多个样本均值比较的方差分析(懿说学区22SPSS统计分析)
Yishuo School District (22) | SPSS Statistical Analysis (32) Multi factor ANOVA

✦ ✦✦ ✦✦ ✦✦ ✦
“分享兴趣,传播快乐,增长见闻,留下美好! 大家好,这里是小编。欢迎大家继续访问学苑内容,我们将竭诚为您带来更多更好的内容分享。
"Share interest, spread happiness, increase knowledge, and leave a good impression! Hello everyone, this is Xiaobian. Welcome to continue to visit the content of Xueyuan, and we will wholeheartedly bring you more and better content to share.
✦ ✦ ✦ ✦ ✦ ✦ ✦ ✦
SPSS
learning
上一期,我们一起学习了单因素方差分析,但是我们发现单因素方差分析只能用来分析单个控制变量对观测变量的影响程度,所以,我们要更进一步地学习多因素的方差分析。
In the last issue, we learned one-way ANOVA together, but we found that one-way ANOVA can only be used to analyze the influence of a single control variable on the observed variables. Therefore, we need to further study the multivariate ANOVA.
多因素方差分析用来研究两个及两个以上的控制变量是否对观测变量产生显著性影响。由于讨论多个因素对观测变量的影响,因此这种方差分析过程被称之为多因素方差分析。多因素方差分析不仅能够分析多个控制因素对观测变量的影响,也能够分析多个控制因素的交互作用对观测变量产生的影响,进而最终找到利于观测变量的最优组合。
Learning Yard
Multivariate analysis of variance is used to study whether two or more control variables have significant effects on the observed variables. Because we discuss the influence of multiple factors on the observed variables, this process of ANOVA is called multifactor ANOVA. Multivariate ANOVA can not only analyze the impact of multiple control factors on the observed variables, but also analyze the impact of the interaction of multiple control factors on the observed variables, and finally find the optimal combination of the observation variables.

多因素方差分析同样也是属于统计推断中的假设检验问题,其基本步骤与假设检验一致,具体如下:
Multi factor ANOVA is also a hypothesis testing problem in statistical inference. Its basic steps are consistent with hypothesis testing, as follows:
\ | /
★
第一步,提出原假设。
多因素方差分析的原假设H0:各控制变量不同水平下观测变量各总体均值无显著性差异,控制变量各效应和交互作用效应同时为0,即控制变量和它们的交互作用对观测变量没有显著产生影响。
The first step is to put forward the original hypothesis.
The original hypothesis of multivariate ANOVA is H0: there is no significant difference in the overall mean values of the observation variables at different levels of the control variables, and the effects and interaction effects of the control variables are 0 at the same time, that is, the control variables and their interactions have no significant impact on the observation variables.
\ | /
★
第二步,构造检验统计量。
多因素方差分析采用的是F统计量,根据效应模型选择情况。
Second, construct test statistics.
Multivariate analysis of variance uses F statistic, which is selected according to the effect model.
\ | /
★
第三步,计算检验统计量的观测值和概率P值
SPSS会自动将数据带入各式,计算出检验统计量的观测值的显著性概率P值(也称相伴概率值)。
Step 3: Calculate the observed value and probability P value of the test statistic
SPSS will automatically bring the data into various categories and calculate the significance probability P value (also known as the associated probability value) of the observation value of the test statistic.
\ | /
★
第四步,给出显著性水平α,作出决策。
给定显著性水平α(系统默认0.05),并与各个检验统计量的概率P值进行比较。在固定效应模型中,如果FA的概率P值小于显著性水平α,则应拒绝原假设,认为控制变量A的不同水平对观测变量的均值产生了显著性影响;反之,则应该接受原假设,认为控制变量A的不同水平对观测变量没有产生显著性影响。同理,可对B的显著性及A和B的交互作用的显著性作推断。
Step 4: Give the significance level α, Make decisions.
Given significance level α (The system defaults to 0.05) and compares it with the probability P value of each test statistic. In the fixed effect model, if the probability P value of FA is less than the significance level α, The original hypothesis should be rejected, and it is believed that the different levels of control variable A have a significant impact on the mean value of the observed variable; On the contrary, we should accept the original assumption that different levels of control variable A have no significant impact on the observed variables. Similarly, the significance of B and the significance of the interaction between A and B can be inferred.
下面,我们来作一个多因素方差分析的SPSS实例运用。
Next, let's make an example of SPSS for multivariate analysis of variance.
已知一个班三组不同性别的同学分别接受了三种不同的教学方法后,在数学成绩上是否有显著性差异,数据如下表所示。
Learning Yard

第一步,分析并组织数据,研究不同教学方法和不同性别对数学成绩的影响。这是一个多因素(双因素)方差分析问题。我们按表组织四列数据,并保存数据文件。
Learning Yard
The first step is to analyze and organize the data to study the effects of different teaching methods and different genders on the math scores. This is a multi factor (two factor) analysis of variance problem. We organize four columns of data by table and save the data file.

实践
Learning Yard
第二步,进行变量设置和方差齐性检验的设置。
选择菜单“分析->一般线性模型->单变量”,按下图所示进行变量设置。
Step 2: Set variables and homogeneity test of variance.
Select the menu "Analysis ->General Linear Model ->Single Variable", and set variables as shown in the figure below.


打开变量设置的“选项”按钮,设置齐性检验。
Open the "Options" button of variable setting to set the homogeneity inspection.

点击“事后比较”,进行控制变量的多重比较分析。
Click "Post comparison" to conduct multiple comparative analysis of control variables.

点击“图”按钮,以图形方式展示交互效果。
Click the "Figure" button to display the interaction effect in a graphical way.

点击“对比”按钮,对控制变量各水平上的观察变量的差异进行对比检验。
Click the "Comparison" button to compare and test the differences of the observed variables at each level of the control variable.


第三步,点击运行,分析主要结果。
Step 3: Click Run to analyze the main results.
Learning Yard
1. 分组描述表示各变量的分组情况。
1. Grouping description indicates the Grouping of each variable.

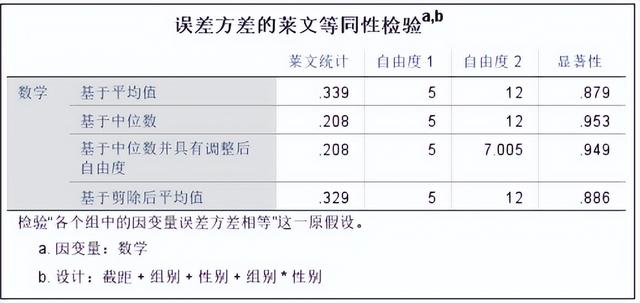
2. 方差齐性检验结果显示显著性概率P值=0.879>0.05,因此可以认为各个组总体方差是相等的,满足方差检验的前提条件。
2. The results of homogeneity of variance test show that the P value of significance probability is 0.879>0.05, so it can be considered that the overall variance of each group is equal, meeting the preconditions of variance test.
3. 多因素方差分析,由于指定建立饱和模型,因此总的离差平方和分为三个部分:多个控制变量对观察量的独立作用、多个控制比哪里的交互作用及随机变量的影响。关于多个随机变量的独立作用部分,不同组别(教学方法)贡献离差平方和为3295.577,均方1647.788,不同性别贡献离差平方和为351.157,均方为351.157。这说明教学方法比性别影响大。从显著性概率来看,均小于0.05,说明两者均对数学成绩有影响。关于多个变量的交互作用分析类似,也对数学成绩具有显著性影响。误差部分是随机变量影响部分。
3. Multi factor analysis of variance. Since the saturation model is specified, the total sum of squares of deviations is divided into three parts: the independent effect of multiple control variables on the observation, the interaction of multiple control variables and the influence of random variables.
As for the independent role of multiple random variables, the sum of squares of contribution deviations of different groups (teaching methods) is 3295.577, with a mean square of 1647.788, and the sum of squares of contribution deviations of different genders is 351.157, with a mean square of 351.157. This shows that teaching methods have greater influence than gender.
From the perspective of significance probability, both are less than 0.05, indicating that both have an impact on mathematical performance. The interaction analysis of multiple variables is similar, which also has a significant impact on mathematical performance. The error part is the part affected by random variables.

4. 从不同组别的均值比较结果可以看出,不同组别之间的显著性概率值小于0.05,因此不同组别之间的均值有显著性差异。
4. It can be seen from the comparison results of the mean values of different groups that the significance probability value between different groups is less than 0.05, so the mean values between different groups have significant differences.

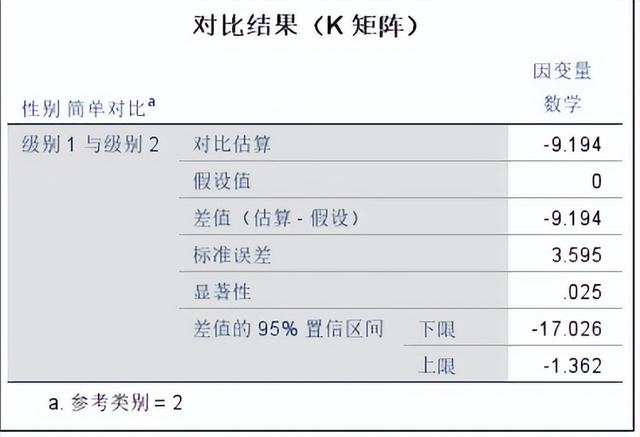
5. 从不同性别的均值比较结果可以看出,不同组别之间的显著性概率值小于0.05,因此不同性别之间的均值有显著性差异。
5. From the comparison results of the mean values of different genders, it can be seen that the significance probability value between different groups is less than 0.05, so there is a significant difference between the mean values of different genders.
6. 对组别进行多重比较,由于前面分析方差具有齐性,从LSD结果可以看出3个水平的显著性均小于0.05,说明三个组之间均存在显著性差异,表中用“*”标出了显著性差异,同时也可以看出其均值的比较性为第0组>第2组>第1组。
6. Make multiple comparisons among groups. Because the variance of the previous analysis is homogeneous, the LSD results show that the significance of the three levels is less than 0.05, indicating that there are significant differences between the three groups. The table uses "*" to mark the significant differences. At the same time, it can be seen that the comparison of the mean is Group 0>Group 2>Group 1.

7. 下图是两控制变量对观测变量的交互作用图,由于两因素相交,说明有交互作用的影响。
7. The following figure shows the interaction between two control variables and observation variables. Because the two factors intersect, it shows that there is interaction.

下期预告:本期,我们学习了
多因素方差分析。
下一期,我们将会学习
协方差分析的理论和实例。
Preview of the next issue: In this issue, we learned the multifactor ANOVA. In the next issue, we will learn the theory and examples of covariance analysis.
今天的分享就到这里了
如果您对今天的文章有独特的想法
欢迎给我们留言
让我们相约明天
祝您今天过得开心快乐!
That's all for today's sharing. If you have unique ideas about today's article, please leave us a message. Let's meet tomorrow. I wish you a happy day today!
参考资料:百度百科,《SPSS 23 统计分析实用教程》
翻译:百度翻译
本文由learningyard新学苑原创,部分文字图片来源于他处,如有侵权,请联系删除
,免责声明:本文仅代表文章作者的个人观点,与本站无关。其原创性、真实性以及文中陈述文字和内容未经本站证实,对本文以及其中全部或者部分内容文字的真实性、完整性和原创性本站不作任何保证或承诺,请读者仅作参考,并自行核实相关内容。文章投诉邮箱:anhduc.ph@yahoo.com