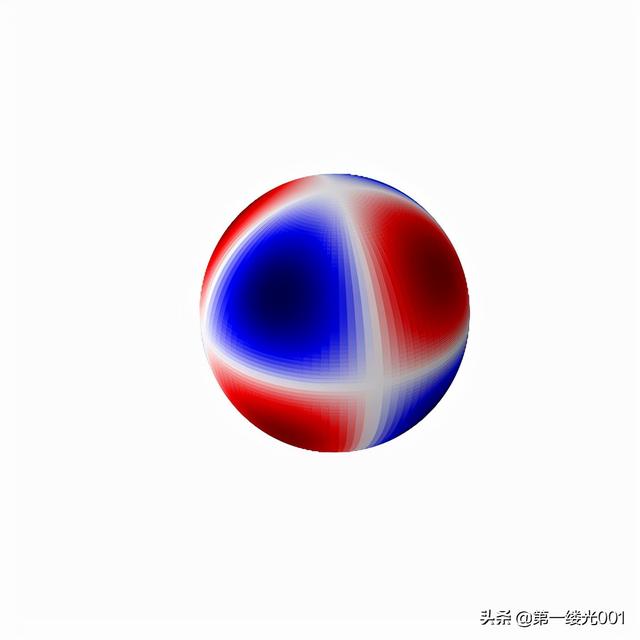
球函数及其应用(球谐函数可视化)
import matplotlib.pyplot as plt
from matplotlib import cm, colors
from mpl_toolkits.mplot3d import Axes3D
import numpy as np
from scipy.special import sph_harm

phi = np.linspace(0, np.pi, 100)
theta = np.linspace(0, 2*np.pi, 100)
phi, theta = np.meshgrid(phi, theta)

# The Cartesian coordinates of the unit sphere
x = np.sin(phi) * np.cos(theta)
y = np.sin(phi) * np.sin(theta)
z = np.cos(phi)

m, l = 2, 3

# Calculate the spherical harmonic Y(l,m) and normalize to [0,1]
fcolors = sph_harm(m, l, theta, phi).real
fmax, fmin = fcolors.max(), fcolors.min()
fcolors = (fcolors - fmin)/(fmax - fmin)

# Set the aspect ratio to 1 so our sphere looks spherical
fig = plt.figure(figsize=plt.figaspect(1.))
ax = fig.add_subplot(111, projection='3d')
ax.plot_surface(x, y, z,  rstride=1, cstride=1, facecolors=cm.seismic(fcolors))
# Turn off the axis planes
ax.set_axis_off()
plt.show()
免责声明:本文仅代表文章作者的个人观点,与本站无关。其原创性、真实性以及文中陈述文字和内容未经本站证实,对本文以及其中全部或者部分内容文字的真实性、完整性和原创性本站不作任何保证或承诺,请读者仅作参考,并自行核实相关内容。文章投诉邮箱:anhduc.ph@yahoo.com