matlab 实体绘图(Matlab三维绘图)

分享兴趣,传播快乐,增长见闻,留下美好。
亲爱的您,
这里是LearingYard学苑!
今天小编为大家带来matlab三维绘图
欢迎您的用心访问!
本期推文阅读时长大约4分钟,请您耐心阅读。
Share interest, spread happiness, increase knowledge, and leave beautiful.
Dear you,
This is the LearingYard Academy!
Today, the editor brings you matlab three-dimensional drawing
Welcome your visit!
This tweet usually takes about 4 minutes to read, please read it patiently.
01
本期主题介绍
The topic of this issue
如果您了解过Matlab,
您肯定知道Matlab不只是计算!
Matlab还有一个强大的绘图功能!
本期话题将对matlab的三维图进行介绍。
请感兴趣的朋友和小编开启
学习Matlab的三维绘图之旅吧!
If you know Matlab,
You must know that Matlab is more than just computing!
Matlab also has a powerful drawing function!
The topic of this issue will introduce the three-dimensional drawing of matlab.
Please open it with interested friends and editors
Learn the journey of two-dimensional drawing in Matlab
02
Matlab三维绘图
Matlab 3D drawing
1.用plot绘制三维图形
Use plot to draw three-dimensional graphics
x=1:5;
y=6:10;
z=x y;
z2=exp(x y);
[x3,y3]=meshgrid(x,y);
z3=x3 y3;
plot3(x,y,z);
plot3(x,y,z2);
plot3(x3,y3,z3);
%mesh可以绘制一段区间的曲面,调用格式mesg(x,y,z)
%注意:在使用函数前,先对xy平面建立网格坐标:[x,y]=meshgrid(x,y)
%其中meshgrid为二维三维网格
mesh can draw a section of curved surface, call the format mesg(x,y,z)
Note: Before using the function, create grid coordinates on the xy plane: [x,y]=meshgrid(x,y)
Where meshgrid is a two-dimensional three-dimensional grid

2.绘制螺旋图
Draw a spiral graph
t=0:pi/60:10*pi;
x=sin(t);
y=cos(t);
plot3(x,y,t,'*-b');

3.三维网格图
Three-dimensional grid map
mesh函数用于绘制三维网格图,其调用语法如下。(1)mesh(x,y,z):绘制三维网格图,x、y、z 分别表示三维网格图形在 x 轴、y 轴和 z 轴 的坐标,图形的颜色由矩阵 z 决定。mesh(Z):绘制三维网格图,分别以矩阵 Z 的列下标、行下标作为三维网格图的 x 轴、y 轴的坐标。
注意事项:在使用函数前,需要先在xy平面建立网格坐标:[x,y]=meshgrid(x,y),然后再利用新的x,y计算网格上对应z的点,从而得到构建曲面所需的点,最后再使用mesh绘制整个图。
The mesh function is used to draw a three-dimensional grid graph, and its calling syntax is as follows.
(1) mesh(x,y,z): draw a three-dimensional grid graph, x, y, z represent the coordinates of the three-dimensional grid graph on the x-axis, y-axis and z-axis, respectively. The color of the graph is determined by the matrix z. mesh(Z): Draw a three-dimensional grid graph, and use the column subscripts and row subscripts of matrix Z as the coordinates of the x-axis and y-axis of the three-dimensional grid graph.
Note: Before using the function, you need to establish the grid coordinates in the xy plane: [x,y]=meshgrid(x,y), and then use the new x,y to calculate the point corresponding to z on the grid to get Construct the points needed for the surface, and finally use the mesh to draw the entire graph.
x=-8:8;
y=-8:8;
[X,Y]=meshgrid(x,y);
Z=(X.^2/4^2-Y.^2/5^2);
meshz(X,Y,Z)

4.绘制柱状图
Draw a histogram
bar3(x,y,z);
bar3(z3);
bar3(z3,'grouped')
bar3(z3,'stacked')
bar3(z3,0.3)

5.绘制直方图
Draw a histogram
%X = randn 返回一个从标准正态分布中得到的随机标量。
%X = randn(n) 返回由正态分布的随机数组成的 n×n 矩阵。
%X = randn(sz1,...,szN) 返回由随机数组成的 sz1×...×szN 数组,其中 sz1,...,szN 指示每个维度的大小。例如:randn(3,4) 返回一个 3×4 的矩阵。
%histogram为绘制直方图
%X = randn returns a random scalar obtained from the standard normal distribution.
%X = randn(n) returns an n×n matrix composed of normally distributed random numbers.
%X = randn(sz1,...,szN) returns an sz1×...×szN array composed of random numbers, where sz1,...,szN indicate the size of each dimension. For example: randn(3,4) returns a 3×4 matrix.
%histogram is to draw a histogram
x4=randn(100,1);
y4=randn(100,1);
histogram2(x4,y4);

6.绘制饼图
Draw a pie chart
pie3(z3)

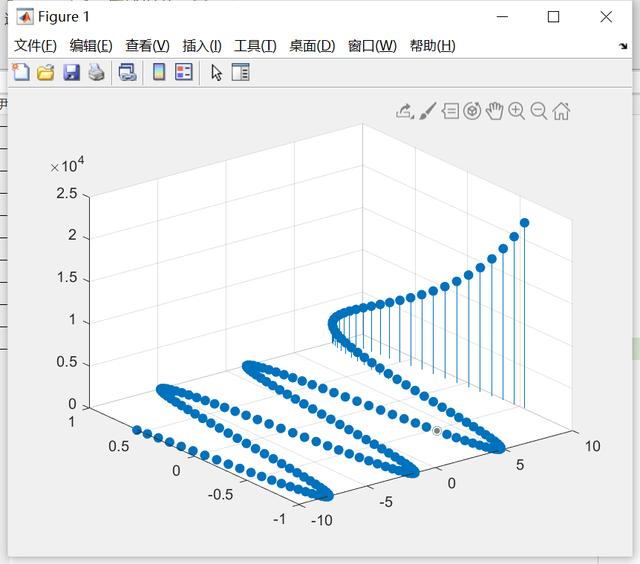
7.绘制“火柴杆图”
Draw a "matchstick map"
%火柴杆数
% Matchsticks
stem3(x3,y3,z3)
t=-10:0.1:10;
xt=t;
yt=sin(t);
zt=exp(t);
stem3(xt,yt,zt,'filled');

8.空间曲面绘图
Space surface drawing
%suf 空间曲面绘图
%surf(x,y,z)画出数据点x,y,z表示的曲面
%画出z=(x y)^2
%suf space surface drawing
%surf(x,y,z) draws the surface represented by data points x,y,z
%Draw out z=(x y)^2
x=-2:0.1:4;
y=1:0.2:8;
[x,y]=meshgrid(x,y);
z=(x y).^3;
surf(x,y,z)
shaing flat

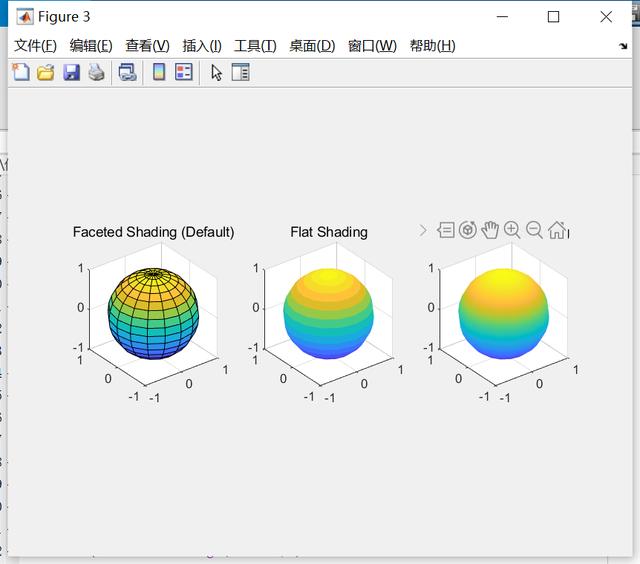
9.subplot的使用,以及shading自由设置图形表面的颜色
The use of subplot and shading freely set the color of the graphic surface
%shaing flat 使用同一种颜色配色
%shading interp 插值处理方式配色
%shaing flat uses the same color
%shading interp color matching
figure
subplot(1,3,1)
sphere(16)
axis equal
title('Faceted Shading (Default)')
subplot(1,3,2)
sphere(16)
shading flat
axis equal
title('Flat Shading')
subplot(1,3,3)
sphere(16)
shading interp
axis equal
title ('iInterpolated Shading')
10.绘制极坐标图
Draw polar coordinates
a=10
k=2
theta=0:pi/50:2*pi;
r=a*sin(k*theta);
h=polar(theta,r)
set(h,'color',[1,0,0],'LineWidth',2)

今天的分享就到这里了。
如果您对今天的文章有独特的想法,
欢迎给我们留言,
让我们相约明天,
祝您今天过得开心快乐!
That's it for today's sharing.
If you have a unique idea about today’s article,
Welcome to leave us a message,
Let us meet tomorrow,
I wish you a happy day today!
LearningYard学苑
,免责声明:本文仅代表文章作者的个人观点,与本站无关。其原创性、真实性以及文中陈述文字和内容未经本站证实,对本文以及其中全部或者部分内容文字的真实性、完整性和原创性本站不作任何保证或承诺,请读者仅作参考,并自行核实相关内容。文章投诉邮箱:anhduc.ph@yahoo.com


