matlab一百个仿真实例(八悦文摘八Matlab二维绘图)
分享兴趣,传播快乐,
增长见闻,留下美好!
亲爱的您,这里LearningYard学苑。
今天小编为大家带来的是《Matlab二维绘图(3)》
大约需要您五分钟的时间。
欢迎您的访问。
Share interest,
spread happiness,
Increase knowledge and leave good news!
Dear you, this is LearningYard Academy.
Today, the editor brings you "Matlab 2D plot (3)"
It will take you about five minutes.
Welcome your visit.

1
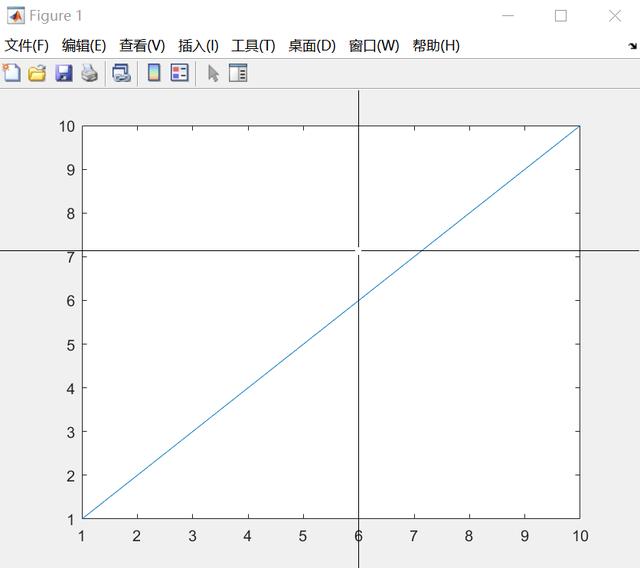
使用鼠标将文本添加到图窗
创建简单的线图并通过 gtext 使用鼠标将文本添加到图窗。
Create simple line graphs and add text to figures using the mouse via gtext.
输入:
plot(1:10)
gtext('My Plot')
可以得到以下图案。
Enter:
plot(1:10)
gtext('My Plot')
The following patterns can be obtained.
2
创建多行 x 轴标签
使用字符向量元胞数组创建多行标签。
Create multiline labels using a cell array of character vectors.
输入:
plot((1:10).^2)
xlabel({'Population','(in thousands)'})
可以得到以下图像。
Enter:
plot((1:10).^2)
xlabel({'Population','(in thousands)'})
The following images can be obtained.

3
将希腊字母包括在 x 轴标签中
使用 TeX 标记将希腊字母和其他特殊字符包括在标签中。
Use TeX markup to include Greek letters and other special characters in labels.
输入:
x = linspace(-2*pi,2*pi);
y = sin(x);
plot(x,y)
xlabel('-2\pi \leq x \leq 2\pi')
可以得到如下图像。
Enter:
x = linspace(-2*pi,2*pi);
y = sin(x);
plot(x,y)
xlabel('-2\pi \leq x \leq 2\pi')
The following image can be obtained.

4
在轴标签中包括上标和下标
使用 '^' 和 '_' 字符在轴标签中包含上标和下标。使用花括号 {} 修改多个字符。
Use the '^' and '_' characters to include superscripts and subscripts in the axis labels. Use curly braces {} to modify multiple characters.
输入:
t = linspace(0,1);
y = exp(t);
plot(t,y)
xlabel('t_{seconds}')
ylabel('e^t')
可以得到以下图像。
Enter:
t = linspace(0,1);
y = exp(t);
plot(t,y)
xlabel('t_{seconds}')
ylabel('e^t')
The following images can be obtained.

5
为特定绘图的 x 轴添加标签
可以使用 tiledlayout 和 nexttile 函数显示分块图。调用 tiledlayout 函数以创建一个 2×1 分块图布局。调用 nexttile 函数以创建坐标区对象 ax1 和 ax2。将数据绘制到每个坐标区中,并为顶部图创建 x 轴标签。
Tiled graphs can be displayed using the tiledlayout and nexttile functions. Call the tiledlayout function to create a 2-by-1 tiled map layout. Call the nexttile function to create the axes objects ax1 and ax2. Plot the data into each axes and create x-axis labels for the top graph.
输入:
tiledlayout(2,1)
ax1 = nexttile;
plot((1:10).^2)
xlabel(ax1,'Population')
ax2 = nexttile;
plot((1:10).^3)
可以得到如下图像。
Enter:
tiledlayout(2,1)
ax1 = nexttile;
plot((1:10).^2)
xlabel(ax1,'Population')
ax2 = nexttile;
plot((1:10).^3)
The following image can be obtained.

6
使用数值输入为 y 轴添加标签
输入:
figure
plot((1:10).^2)
ylabel(123)
可以得到以下图像。
Enter:
figure
plot((1:10).^2)
ylabel(123)
The following images can be obtained.

7
创建多行标签
使用多行元胞数组创建多行标签。
Create multiline labels using a multiline cell array.
输入:
figure
plot((1:10).^2)
ylabel({2010;'Population';'in Years'})
可以得到如下图像。
Enter:
figure
plot((1:10).^2)
ylabel({2010;'Population';'in Years'})
The following image can be obtained.

8
在轴标签中包括上标和下标
使用 '^' 和 '_' 字符在轴标签中包含上标和下标。使用花括号 {} 修改多个字符。
Use the '^' and '_' characters to include superscripts and subscripts in the axis labels. Use curly braces {} to modify multiple characters.
输入:
t = linspace(0,1);
y = exp(t);
plot(t,y)
xlabel('t_{seconds}')
ylabel('e^t')
可以得到以下图像。
Enter:
t = linspace(0,1);
y = exp(t);
plot(t,y)
xlabel('t_{seconds}')
ylabel('e^t')
The following images can be obtained.

编辑切换为居中
添加图片注释,不超过 140 字(可选)
9
创建 y 轴标签并设置字体属性
使用 Name,Value 对组设置 x 轴标签的字体大小、字体粗细和文本颜色属性。
Use Name,Value pairs to set the font-size, font-weight, and text-color properties of the x-axis labels.
输入:
figure
plot((1:10).^2)
ylabel('Population','FontSize',12,...
'FontWeight','bold','Color','r')
可以得到如下图像。
Enter:
figure
plot((1:10).^2)
ylabel('Population','FontSize',12,...
'FontWeight','bold','Color','r')
The following image can be obtained.

编辑切换为居中
添加图片注释,不超过 140 字(可选)
10
为特定坐标区的 y 轴添加标签
可以使用 tiledlayout 和 nexttile 函数显示分块图。调用 tiledlayout 函数以创建一个 2×1 分块图布局。调用 nexttile 函数以创建坐标区对象 ax1 和 ax2。将数据绘制到每个坐标区中,并为顶部图创建 y 轴标签。
Tiled graphs can be displayed using the tiledlayout and nexttile functions. Call the tiledlayout function to create a 2-by-1 tiled map layout. Call the nexttile function to create the axes objects ax1 and ax2. Plot the data into each axes and create y-axis labels for the top plot.
输入:
tiledlayout(2,1)
ax1 = nexttile;
plot((1:10).^2)
ylabel(ax1,'Population')
ax2 = nexttile;
plot((1:10).^3)
可以得到以下图像。
Enter:
tiledlayout(2,1)
ax1 = nexttile;
plot((1:10).^2)
ylabel(ax1,'Population')
ax2 = nexttile;
plot((1:10).^3)
The following images can be obtained.

今天的分享就到这里了。
如果您对今天的文章有独特的想法,
欢迎给我们留言,
让我们相约明天,
祝您今天过得开心快乐!
That's it for today's sharing.
If you have a unique idea for today's article,Welcome to leave us a message.
Let's meet tomorrow.
I wish you a great day today!
参考资料:谷歌翻译、百度
本文由Learning Yard学苑整理并发出,如有侵权,请联系删除。
,免责声明:本文仅代表文章作者的个人观点,与本站无关。其原创性、真实性以及文中陈述文字和内容未经本站证实,对本文以及其中全部或者部分内容文字的真实性、完整性和原创性本站不作任何保证或承诺,请读者仅作参考,并自行核实相关内容。文章投诉邮箱:anhduc.ph@yahoo.com