next数据结构图解(绘制网络拓扑工具)
NeXt-UI是什么?
NeXt UI 工具包是一个基于 HTML5/JavaScript 的网络 Web 应用程序工具包。它提供了一个以网络为中心的拓扑 UI 组件,具有高性能和丰富的功能。NeXt 可以显示大型复杂网络拓扑、聚合网络节点、流量/路径/隧道/组可视化,它包括不同的布局算法、地图叠加和预设的用户友好交互。
---转载自NeXt-UI的GItHub地址简介https://github.com/NeXt-UI/next-bower
虽然NeXt-UI已经停止更新了,但是思科仍然在官网上花了很大篇幅展示这个模块,这也正是我们要学习这个模块的理由.

好了,话不多说,开始正文部分吧。
首先我们需要在cisco网页上down下NeXt-UI的文件包 https://d1nmyq4gcgsfi5.cloudfront.net/fileMedia/025dc509-8f2a-474a-b6d8-75e73ecbd6ac/NeXt_trial.zip
- 下载好软件后解压
- 新增APP文件
- APP内写入app.js以及data.js
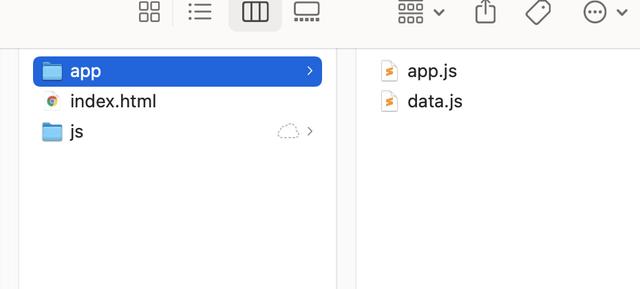

文件的架构大概就是上面的那个类型,然后我们开始构建拓扑所需要的文件
一、新建一个index.html文件***/NEXTUI/js/next/css/next.css 这一块地址可以写相对路径也可以写绝对路径
<!DOCTYPE html>
<html>
<head>
<link rel="stylesheet" href="***/NEXTUI/js/next/css/next.css">
<script type="text/javascript" src="***/NEXTUI/js/next/js/next.js"></script>
</head>
<body>
这是一个新的NeXt-UI文件
</body>
</html>
二、更改app.js的配置,这个是调用data.js的文件,一般无需更改
(function(nx){
// instantiate NeXt app
var app = new nx.ui.Application();
// configuration object for next
var topologyConfig = {
// special configuration for nodes
"nodeConfig": {
"label": "model.name",
"iconType": "router"
},
// special configuration for links
"linkConfig": {
"linkType": "curve",
},
// if true, the nodes' icons are shown, otherwise a user sees a dot instead
"showIcon": true,
// automatically compute the position of nodes
"dataProcessor": "force",
"width": 1920,
"height": 1080,
};
// instantiate Topology class
var topology = new nx.graphic.Topology(topologyConfig);
// load topology data from app/data.js
topology.data(topologyData);
// bind the topology object to the app
topology.attach(app);
// app must run inside a specific container. In our case this is the one with id="topology-container"
app.container(document.getElementById("topology-container"));
})(nx);
三、更改data.js的路径,这边就是写的设备的一些信息,主要分为三个部分nodes、links、nodeSet
ndoes:代表某一个设备,里面的内容都是设备的相关信息。
links:代表哪几个设备相关联,分为source和target
nodeSet;代表哪几个设备为一个分组。一个分组可以在页面展示为一个设备,需要时可以展开
配置如下
var topologyData = {
nodes: [
{
"id": 0,
"name": "New York",
"mgmt_ip": "1.1.1.1",
"icon": "switch"
},
{
"id": 1,
"name": "Los Angeles",
"mgmt_ip": "1.1.1.2",
"icon": "router"
},
{
"id": 2,
"name": "Houston",
"mgmt_ip": "1.1.1.3"
},
{
"id": 3,
"name": "Beijing",
"mgmt_ip": "1.1.1.4"
}
],
links: [
{
"source": 0,
"target": 1
},
{
"source": 0,
"target": 2
},
{
"source": 0,
"target": 3
},
{
"source": 3,
"target": 2
}
],
nodeSet: [
{
"id": 4,
"nodes": [1,2]
}
],
};
现在我们只需要打开index.html文件即可看到网络拓扑图了
后面我们可以讲一下如何使用nornir NeXt-UI来自动绘制拓扑
,免责声明:本文仅代表文章作者的个人观点,与本站无关。其原创性、真实性以及文中陈述文字和内容未经本站证实,对本文以及其中全部或者部分内容文字的真实性、完整性和原创性本站不作任何保证或承诺,请读者仅作参考,并自行核实相关内容。文章投诉邮箱:anhduc.ph@yahoo.com